Week 1 Introduction to Remote Sensing
Overview
For the first week, we are introduced to the concept of remote sensing and how to download data and images collected by satellites and perform basic analysis with SNAP and R. Remote sensing is part of GIS but it involves more than just GIS.
Remote Sensing Overview
Active vs Passive sensors
- Active: Emits EM waves or other energy from its own sensors (radar, LiDar etc.) to measure and capture the landscapes/features of the area of interest.
- Passive: Detects and captures the natural energy signals radiated by of the area of interest.
A key concept in remote sensingis the electromagnetic waves and their interaction with the atmosphere and the Earth’s surface. I have also revisited the concept of diffusion, reflection, refraction and diffraction. Understanding such interactions is pivotal for interpreting satellite imagery and other remote sensing data. Thus, correction of atmospheric interference accurately is one of the most important directions of work for remote sensing.
Data in Remote Sensing:
There are many types of data in remote sensing, we can broadly categorise them into the following:
- Spectral Data: Measure of light reflectance or emission across the electromagnetic spectrum (different wavelength).
- Spatial Data: Location information, size, shape or other features of the Earth’s surface.
- Temporal Data: “Simply data that represents a state in time.” i.e. the remote sensing data with time stamps.
- Radiometric Data: The intensity of radiation captured by sensors, indicating the percentage of the sensed wavelength is being emitted or reflected.
- Resolution Data: Describing the raw data’s spatial, spectral, temporal, and radiometric resolution.
- Multispectral Data: It means the data that contains two or more sets of EM frequencies.
- Hyperspectral Data: Data from all available bands on spectrum.
- Thermal Data: Data collected from thermal remote sensing, usually collected from a sensor’s thermal band.
- LiDar Data: Utilise laser to collect point-cloud data thus capturing three-dimensional information about the Earth’s surface.
- Radar Data: Data collected from sampling back-scattered electromagnetic waves.
- Optical Data: Data from the visible, near infrared and short-wave-infrared bands on the EM spectrum.
- Gravity and Magnetic Field Data: offering insights into the gravitational and magnetic conditions of the Earth.
- Metadata: information that describes a dataset, usually covering dataset’s content, time of collection, quality, publisher, and other characteristics.
Four resolutions: Remotely sensed data and applications will vary based on the four resolutions
- Spatial: Refers to the size of one pixel on the ground (e.g. 20cm or 30m) Higher Spatial resolution means finer details.
- Spectral: Describes the number and width of spectral bands the sensor records data in.
- Temporal: The frequency with which a sensor revisits the same location. A chart of temporal resolution for Visible/NIR Satellites. (Sutlieff, Berthoud, and Stinchcombe 2021)
- Radiometric: identify differences in light or reflectance, in practice this is the range of possible values, for example, an 8-bit sensor has values between 0 and 255 (256 possibilities), captures much fewer energy levels than an 11-bit sensor has values between 0 and 2047 (2048 possibilities), in this sense, the 11-bit sensors captures finer-grained data.
Case Study of Bristol
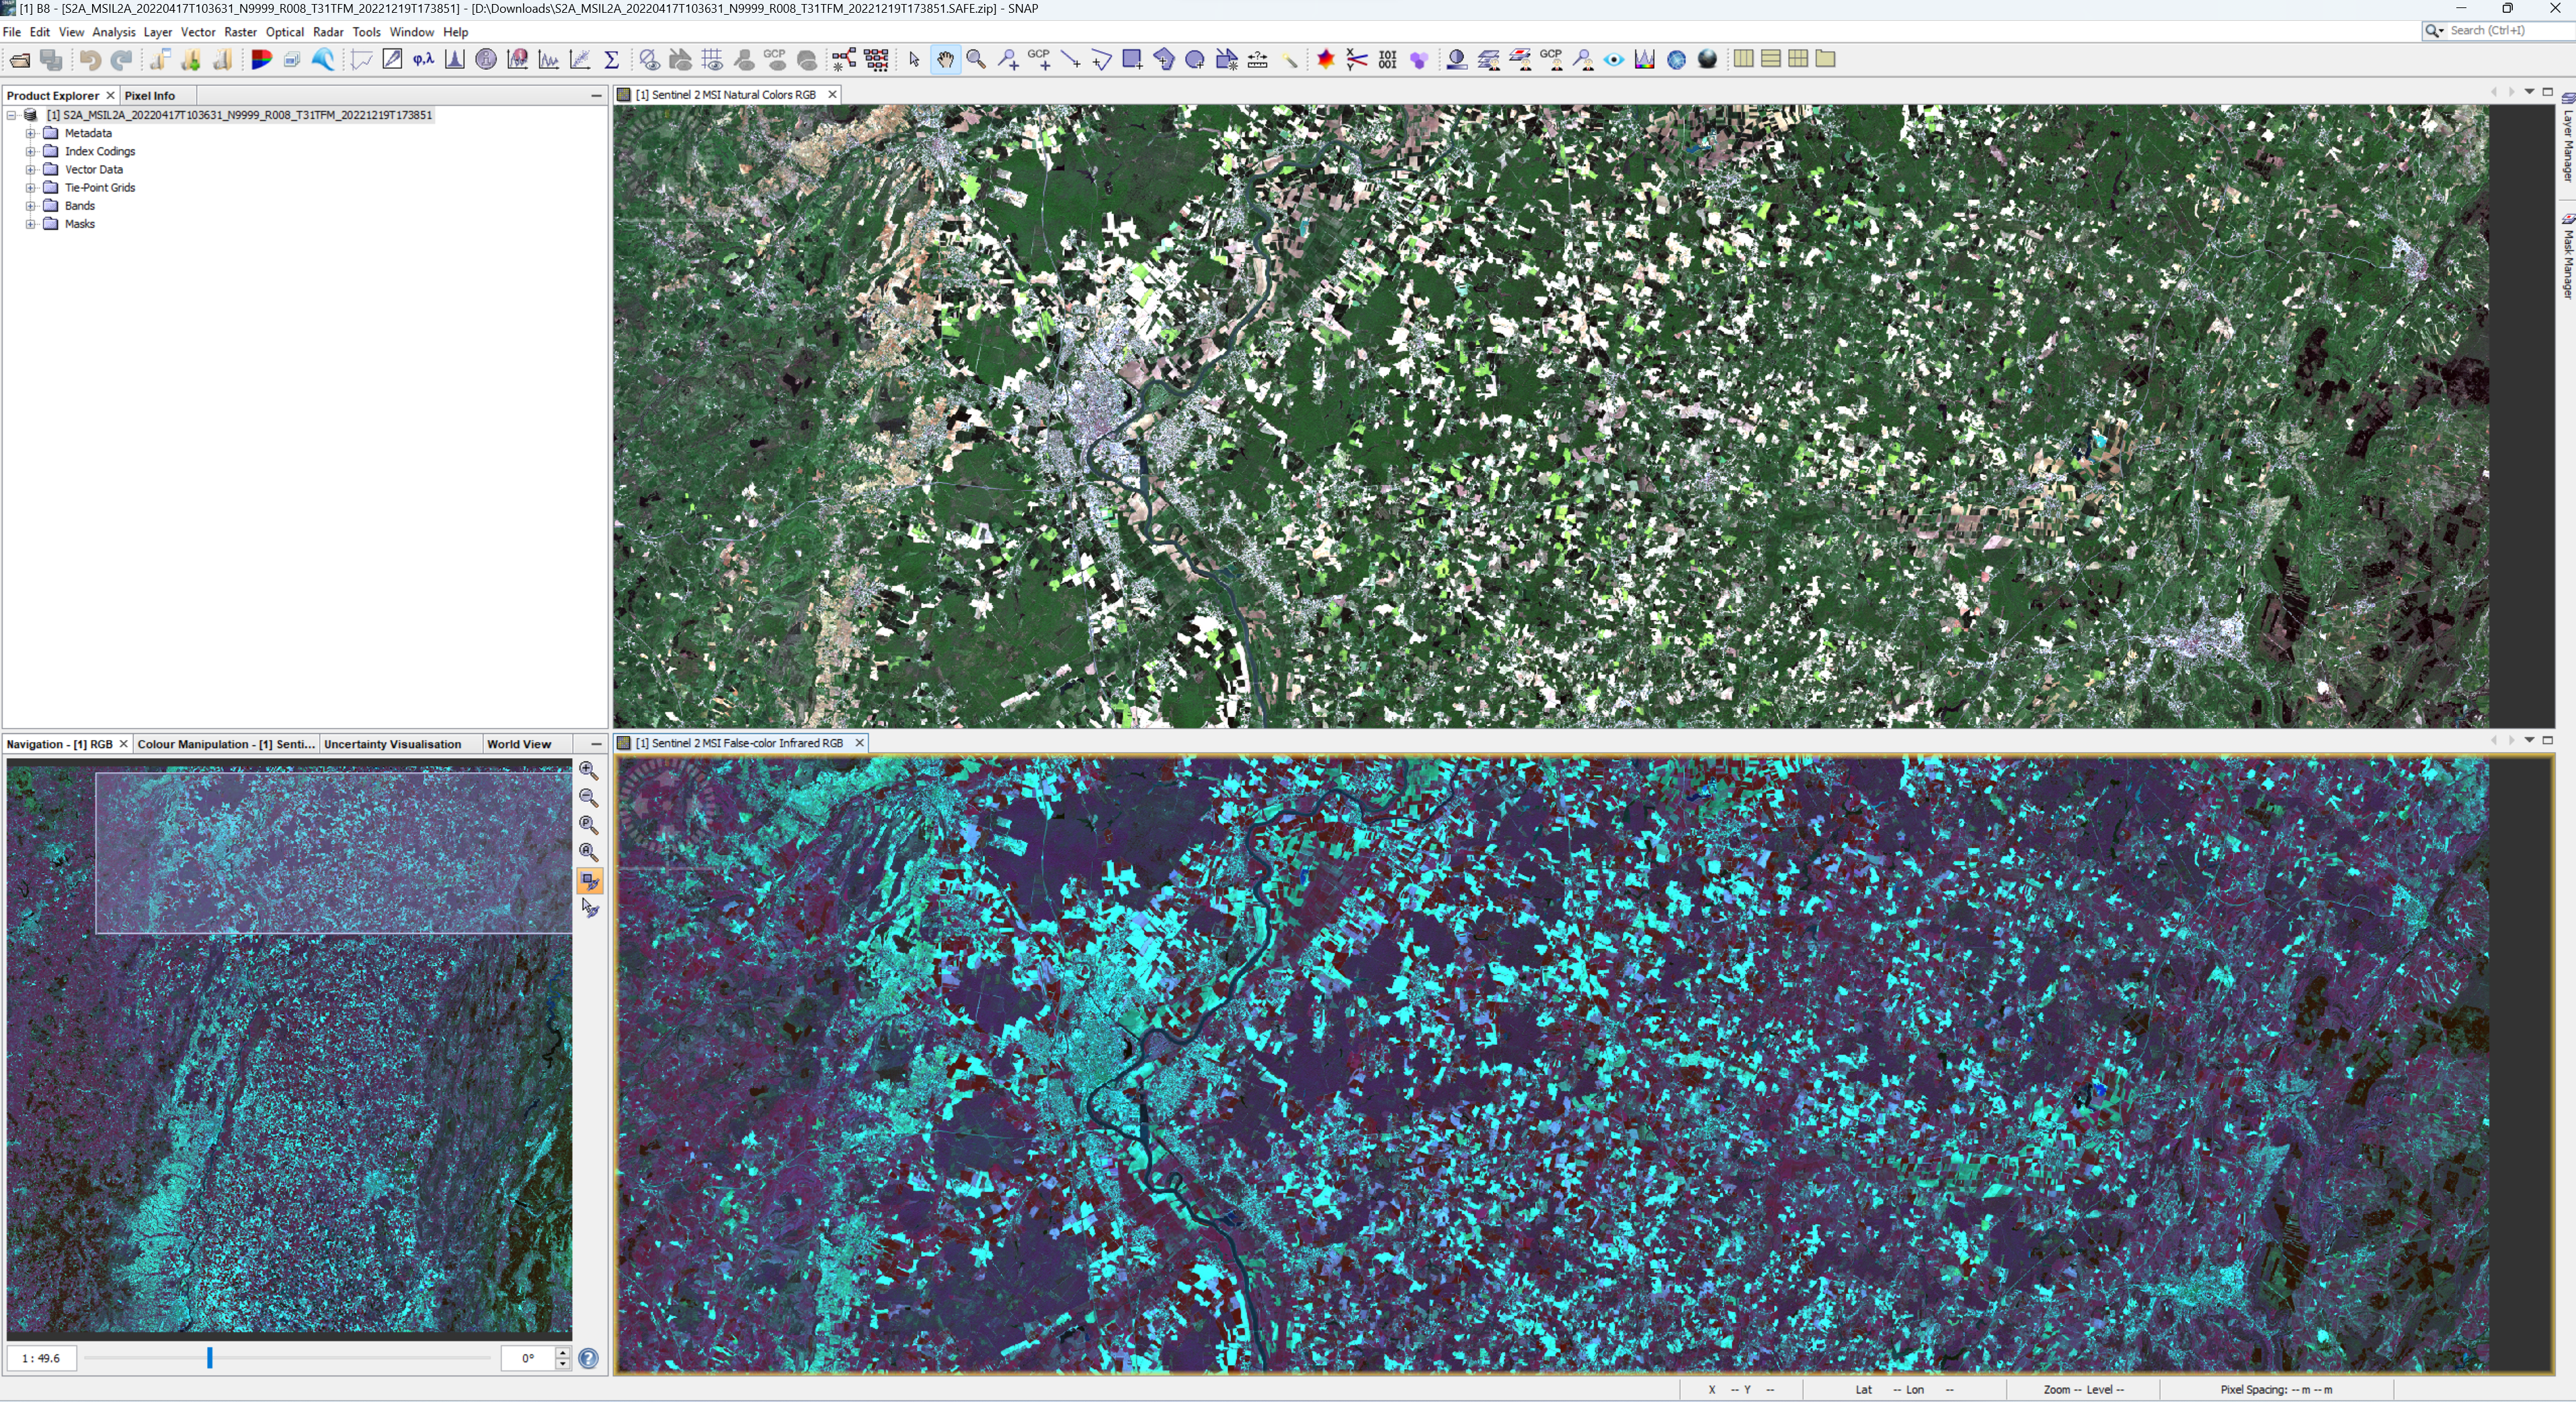
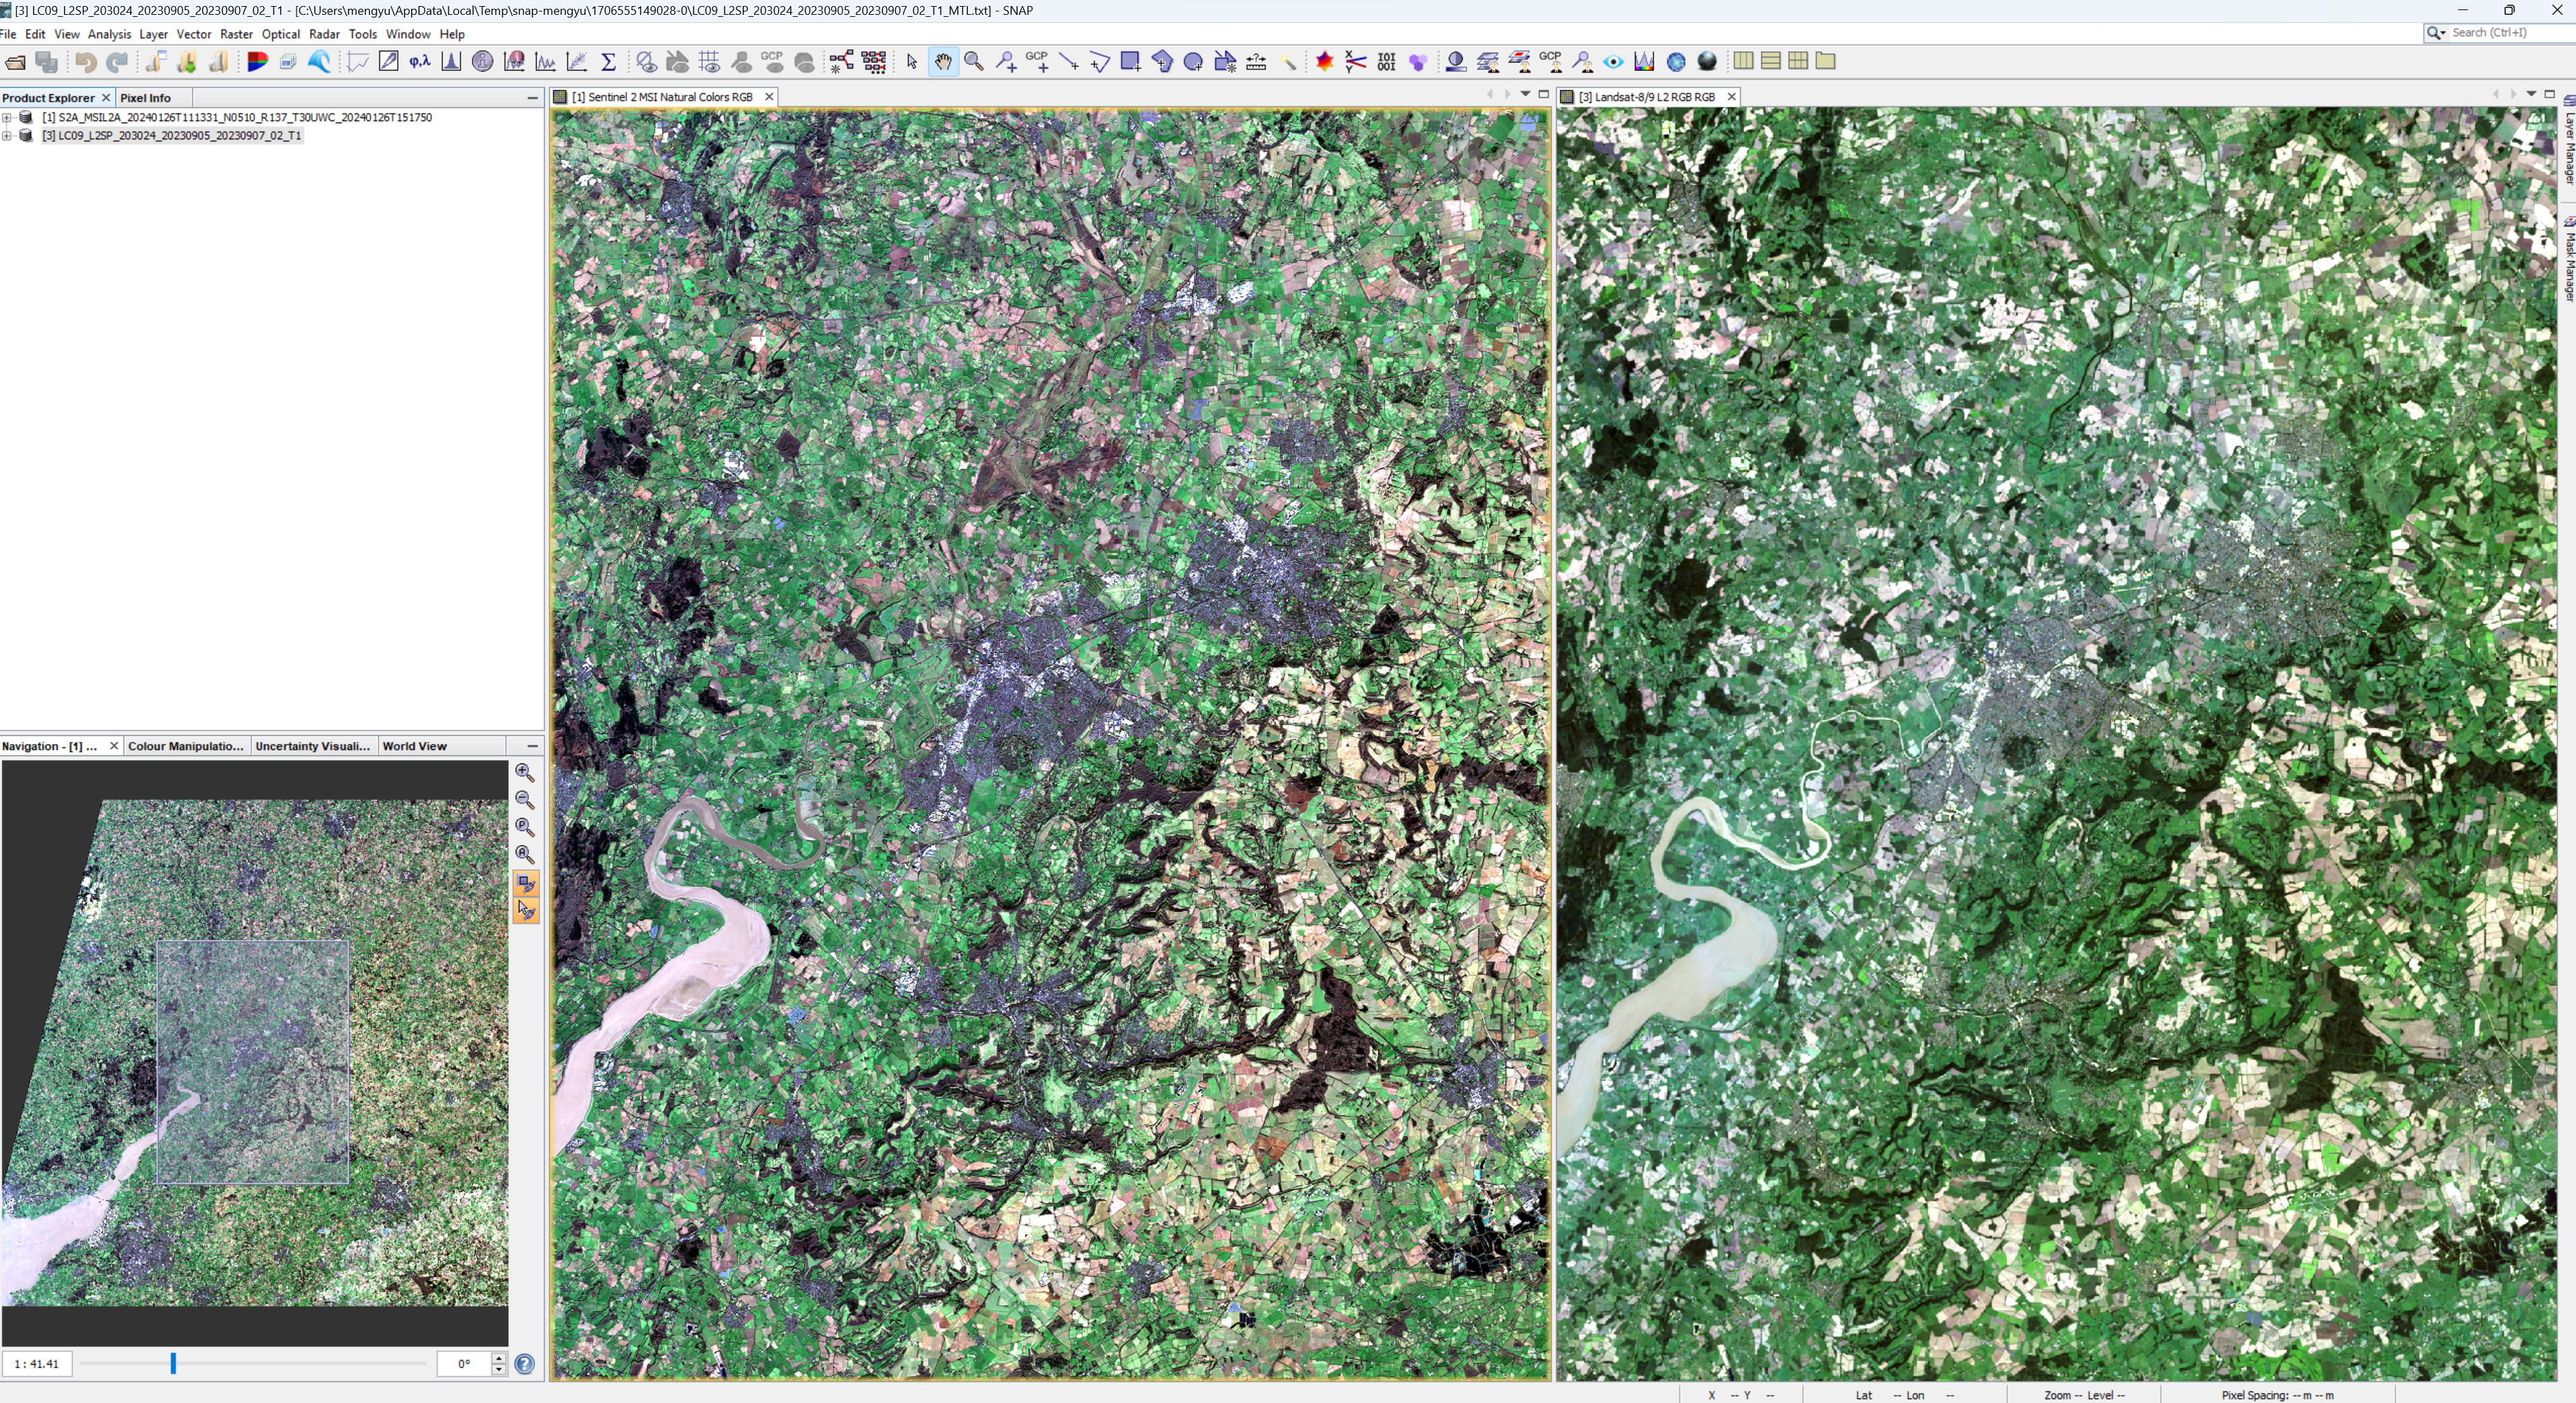
For this practical, I picked Bristol as its distinct urban and suburb area split. The data is downloaded from EU Copernicus Data Portal and Earth Explorer. The Sentinel 2A data is from April 17th, 2022 and the Landsat 8 data is from Sept 07th, 2023.
First, I performed a scatter analysis for the greater Bristol area that I have picked for the analysis, this includes a large portion of suburb land, which indicates high biomass in the analysis.


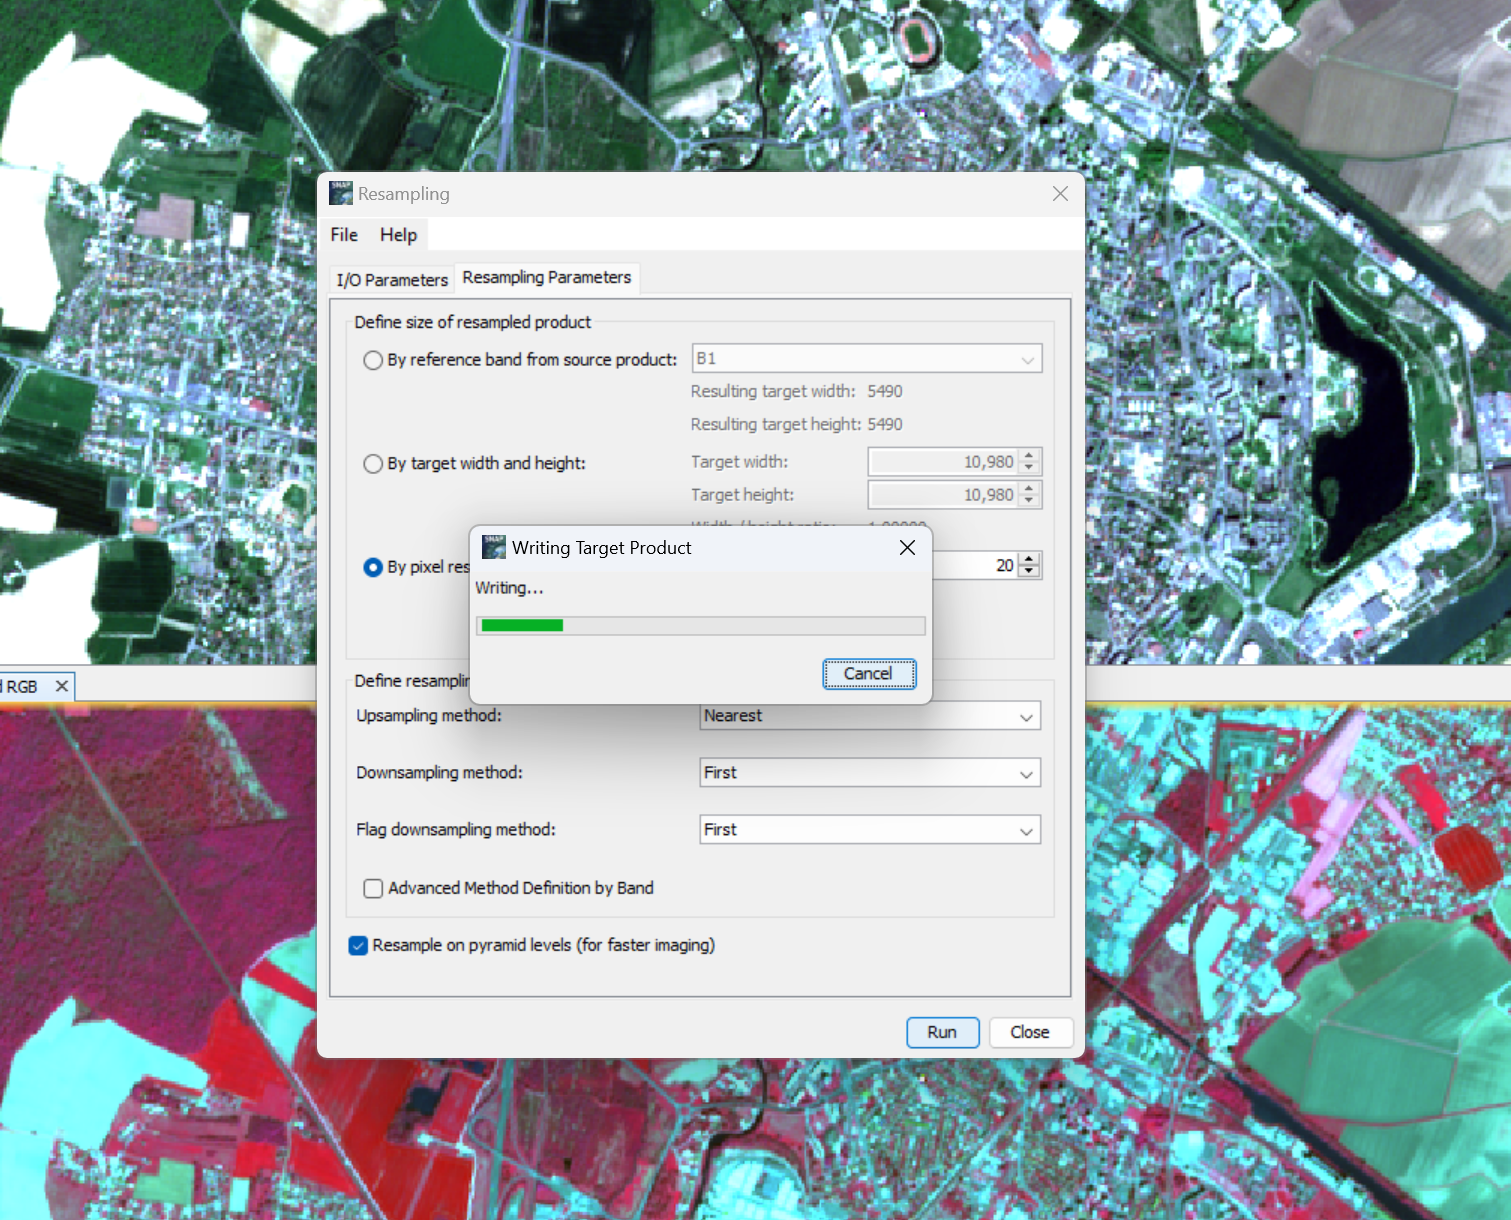
Later on, I performed the down sampling for Sentinel-2A images to align its resolution with Landsat images.

Results
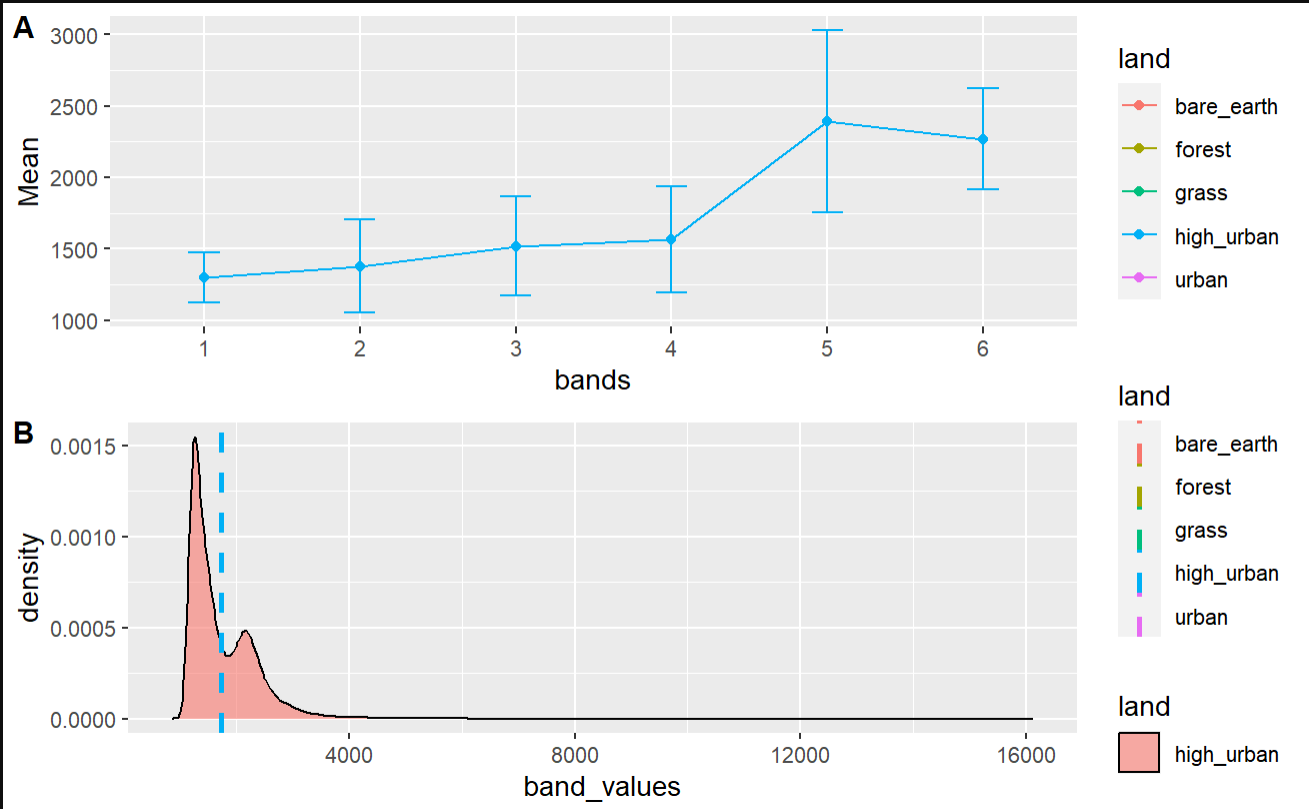
After down-sampling Sentinel images and cross-analyzing it with LandSat of the POI, downtown area of Bristol, the result is recorded below, indicating high urban.

Literature Review and Applications
Remote sensing is certainly more than what I have previously pictured, which involves mainly a great deal of image processing. On the contrary, it consists of a balanced amount of geophysics, actual physics, and last but not least geography. (Navalgund, Jayaraman, and Roy 2007) In short, it is an interdisciplinary realm comprised of decades of studies and applications. While traditional image processing or computer vision certainly plays an important role, (Wilkinson 1999) further development in remote sensing certainly will demand a deep understanding of GIS, atmospheric science, spectral analysis, environmental science, ecology, and sensor technology etc. (Batty 2013) Recent development in the research of transportation highlights the integration of remote sensing data into hybrid models for specific urban topics such as travel behaviour prediction.(Wang et al. 2024) The utility of remote sensing has traditionally been rooted in agricultural applications, however, its relevance to urban studies is increasingly being recognized, such as its application in urban sustainability. (Sabri et al. 2022)
Reflections
Aside from the metaphysical overview of remote sensing as an interesting area of research, I further browsed around EU Copernicus Data Portal and Earth Explorer to see what data I can have access to, for future research uses within and beyond the module. This week’s introduction to remote sensing is intriguing, as when I was young I was always curious about our planet and I used to spend quite some time reading Nature History / Chinese National Geography. (and later on National Geographic in English) I have known that remote sensing enables the modern map makers to create highly-accurate images but never had the opportunity to dive deep into this realm.
Remote sensing plays a pivotal role in environment monitoring and management which could potentially benefit many aspects of urban development and research offering key insights for urban resilience and combating climate change. Back when I was working with other ITS engineers in China, I have witnessed how remote sensing and UAV sensing is used for calibrating HD Maps. During that time, my tasks was primarily centred on the Vehicle-to-Everything (V2X) implementations and solution design. However, engaging in discussions about the application of Light Detection and Ranging (LiDar) technology in Unmanned Aerial Vehicle surveys, and the subsequent processing of the acquired raw data, presented an intriguing aspect of the project. My initial industrial knowledge of how satellite works and their communication bands etc. come from the person standing on my left, Mr. Ji, who was an experienced GIS engineer fluent in UAV survey data processing. He was a happy engineer and always willing to share his technical take, many of my UCL classmates has the same energy as Mr. Ji back in the days.